I tried on an old laptop (bought in 2009) to compute some parts of the Mandelbrot set with a python program, using advanced coloring techniques. Note that generally, people add some piece of code to automatically color the pixels from the main cardioid and the main circle. I did not use such code for the biggest images since I am essentially interested in zooms at the border of the main Cardioid where this kind of code costs more than it saves computing time. But for those interested, I used a simple function like this (uncomment lines to activate the main cardioid and disk detection):
# function defining a color for the outside of a mandelbrot set and (0,0,0) inside.
def mandelbrot(x, y):
	c0 = complex(x, y)
	#c1 = abs(c0)
	#c2 = c1**2
	#c3 = abs(c0+1)
	#if c2*(8*c2-3) < 3/32 - x:
	#	return (0,0,0)
	#if c3 < 1/4:
	#	return (0,0,0)
	c = 0
	for i in range(1, maxiter):
		if abs(c) > 2:
			return rgb_conv(i)
		c = c * c + c0
	return (0, 0, 0)
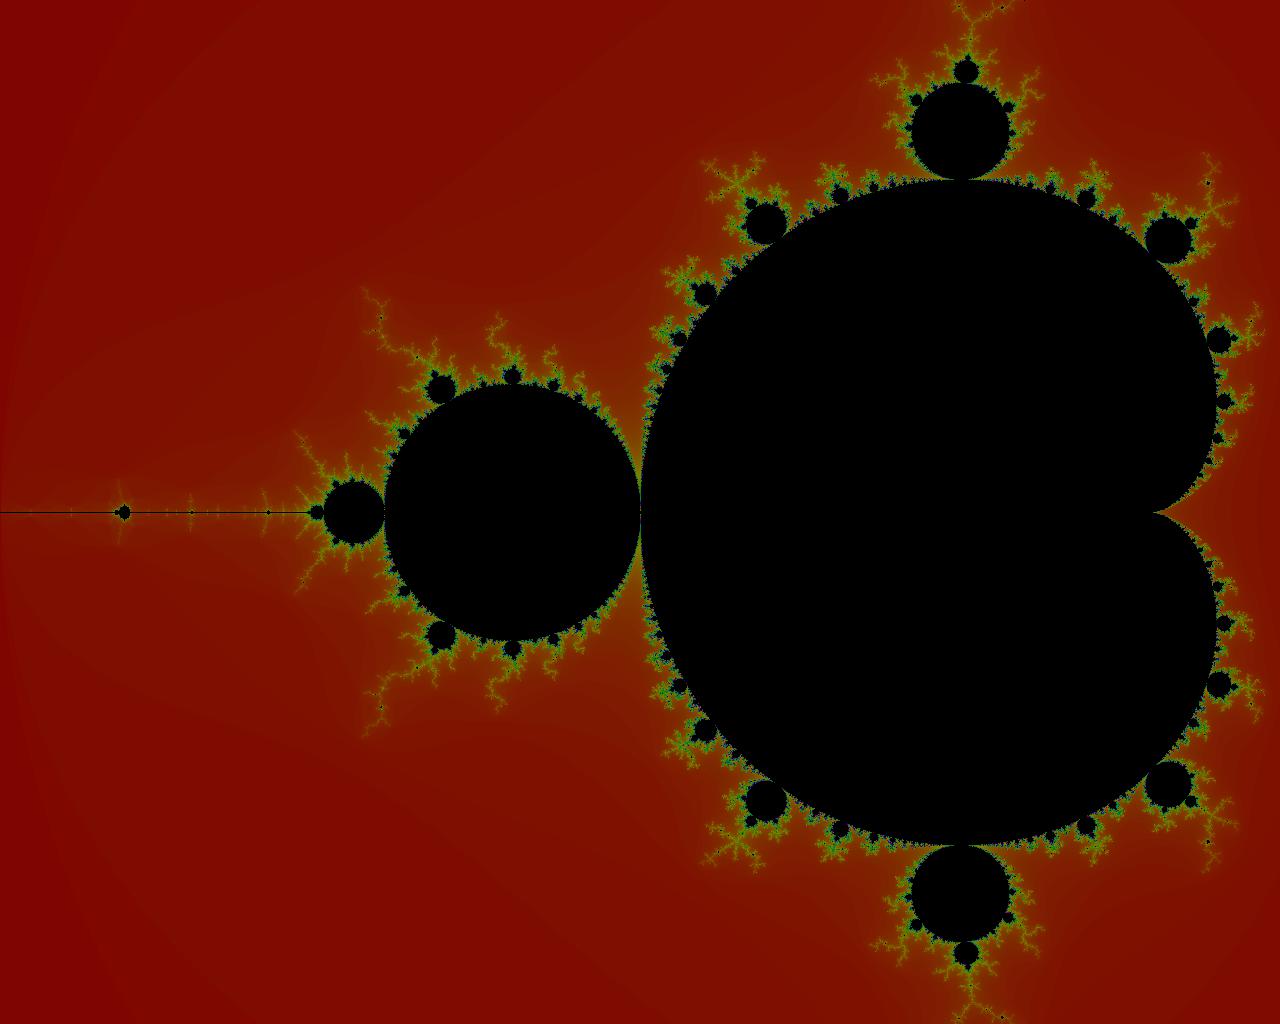
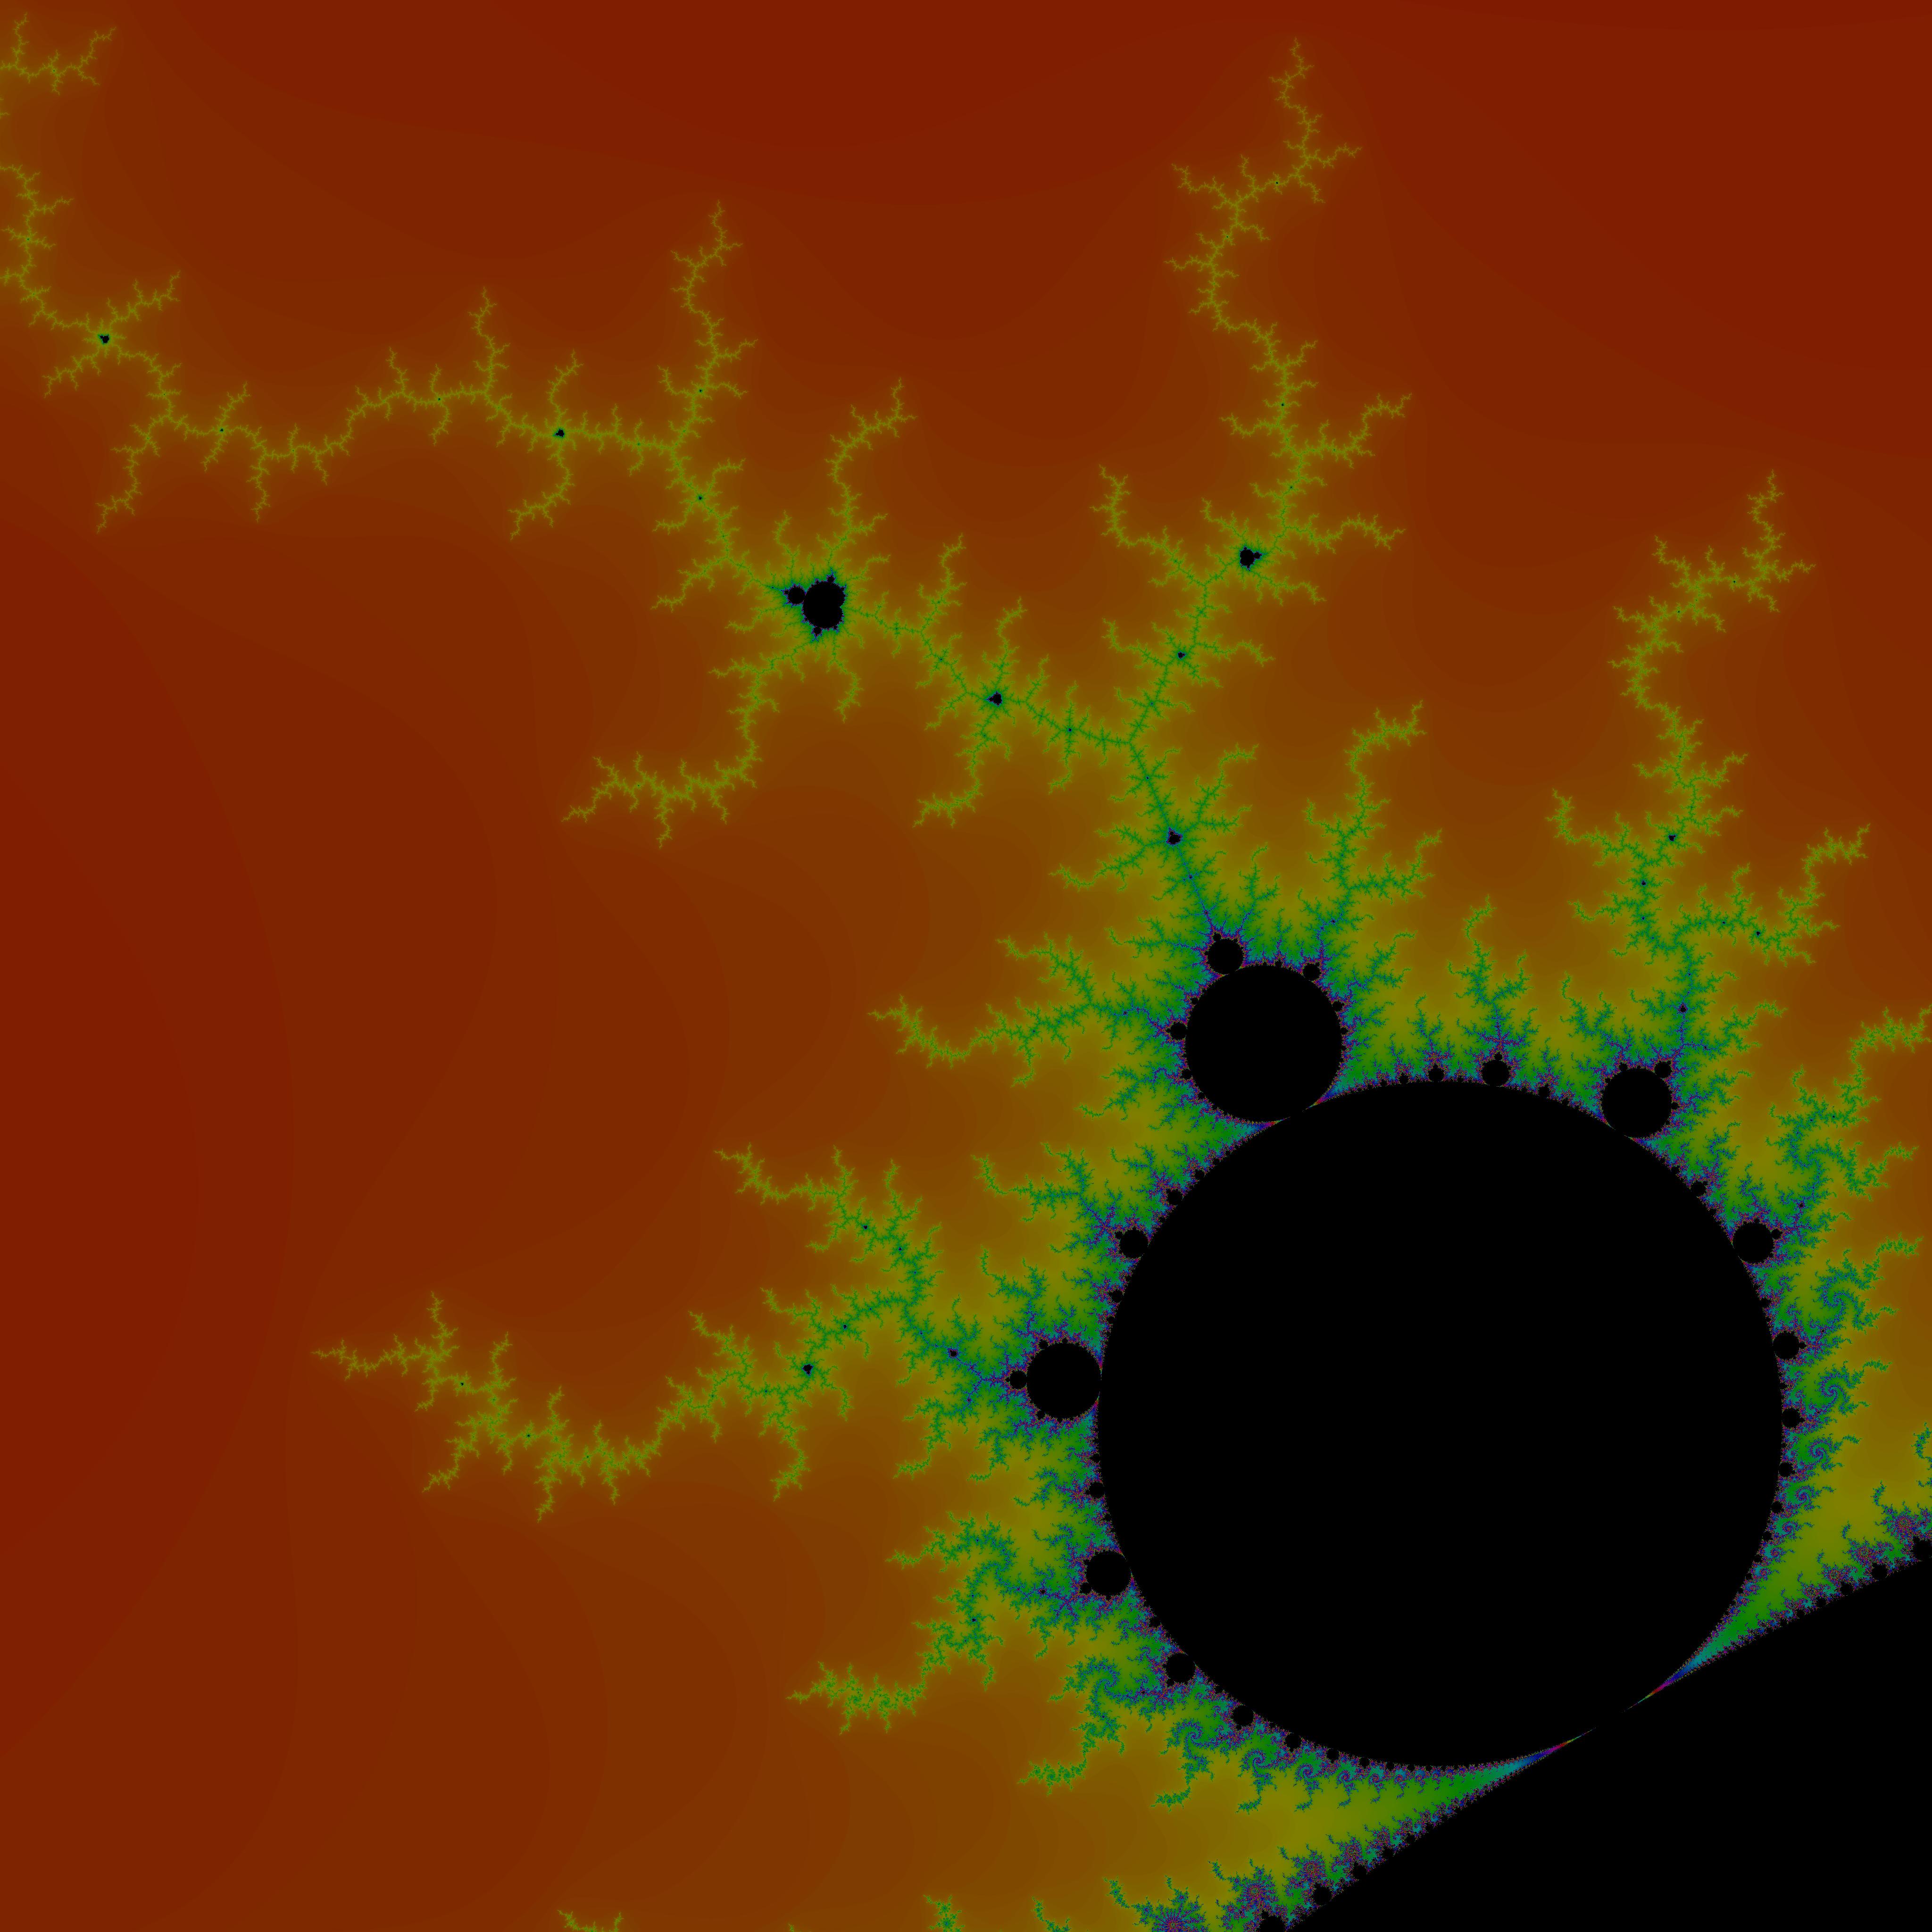
For the advanced coloring techniques I collected informations from miscellaneous websites, but I found the website of Arnaud Cheritat particularly detailled to implement these techniques. In the code I also used some counters to display the number of pixels for which we saved some computing time using the interior detection or the border distance estimation.
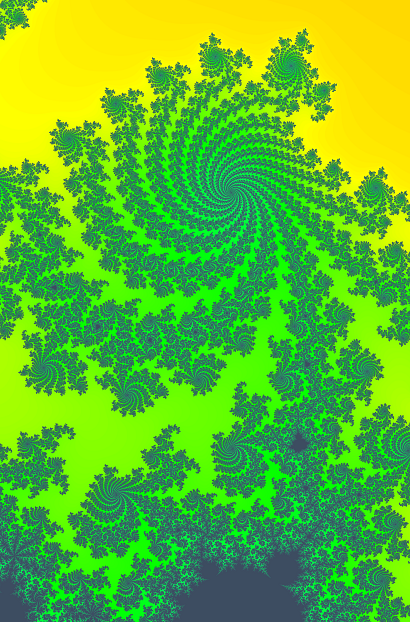
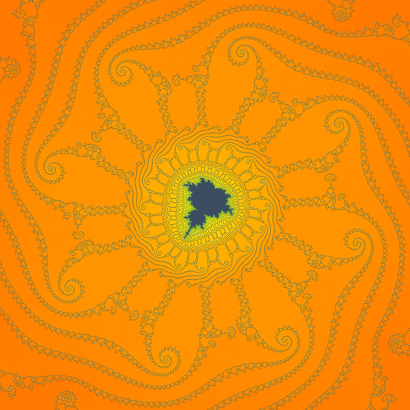
Below are my best images (computing time of around 16 hours for the 2 big ones), followed by the python code I used. The 2 first used only a simple escape time algorithm to compute the color values.
 xmin/max=-0.7746806106269039-/+0.000000000001506/2.0

 ymin/max=-0.1374168856037867-/+0.000000000001506/2.0
# Python code for Mandelbrot Fractal

# Import necessary libraries
from PIL import Image
from numpy import complex, array
import colorsys
import math
import datetime

# nb of pixels (horizontally)
#H=8192
#H = 4096
#H = 2048
H = 1024
#H=512
xmin=-2.0
xmax=0.5
ymin=-1.0
ymax=1.0

xmin=-1.25
xmax=-1.1
ymin=-0.35
ymax=-0.2

xmin=-1.21
xmax=-1.1
ymin=-0.31
ymax=-0.2

#xmin=-1.17
#xmax=-1.15
#ymin=-0.30
#ymax=-0.28

xmin=-0.712
xmax=-0.7092
ymin=-0.2487
ymax=-0.24445

xmin=-0.71013
xmax=-0.70966
ymin=-0.24604
ymax=-0.24551

xmin=-0.70989
xmax=-0.70966
ymin=-0.24604
ymax=-0.24586

#Nice zone found on Paul Bourke website => maxiter=20000
xmin=-0.7746806106269039-0.000000000001506/2.0
xmax=-0.7746806106269039+0.000000000001506/2.0
ymin=-0.1374168856037867-0.000000000001506/2.0
ymax=-0.1374168856037867+0.000000000001506/2.0

maxiter=2000
k=math.exp(-1.0/100)
kp=1.0-k
R=1000000000.0**2
#mandel_color=(74,107,44)
mandel_color = tuple([61,77,97])
#print(mandel_color)
mandel_color_hsv = colorsys.rgb_to_hsv(mandel_color[0]/255.0,mandel_color[1]/255.0,mandel_color[2]/255.0)
#print(mandel_color_hsv)
x0=0.0
y0=0.0
# variables for the derivative used for distance estimator
derx=1.0
dery=0.0
derx2=0.0
dery2=0.0
derx0=0.0
dery0=0.0
# variables for the derivative used for interior detection
derintx=0.0
derinty=0.0
derintx2=0.0
derinty2=0.0
derintx0=0.0
derinty0=0.0

zx=0.0
zy=0.0
zx2=0.0
zy2=0.0
r2=0.0
rd2=0.0
d2=0.0
t=0.0
reason=False # = not enough iterates , True = we are outside
thick=0.02
eps = 0.01
n0=0
n1=0
n2=0
# a function to return a tuple of colors
# as integer valwue of rgb
def rgb_conv(i,t):
    color = 255 * array(colorsys.hsv_to_rgb((1-k**i)/4*t+mandel_color_hsv[0]*(1-t), t+mandel_color_hsv[1]*(1-t), t+mandel_color_hsv[2]*(1-t)))
    #color = 255 * array(colorsys.hsv_to_rgb((k**i)/2, 1.0, 1.0))
    return tuple(color.astype(int))

# creating the new image in RGB mode
DX=xmax-xmin
DY=ymax-ymin
HY = int(H*DY/DX)
DX2=DX/H
DY2=DY/HY
# calcul du seuil
seuil = 2*(thick*DX2)**2
img = Image.new('RGB', (H,HY) )
pixels = img.load()

for x in range(H):
    # displaying the progress
    if x % 64==0:
        print(str(x) + ' - ' + str(datetime.datetime.now())+' - n0='+str(n0))
        n1+=n0
        n0=0
    for y in range(HY):
        x0=xmin+x*DX2
        y0=ymin+y*DY2
        zx=x0 #0.0
        zy=y0 #0.0
        zx2=zx**2 #0.0
        zy2=zy**2 #0.0
        derx=1.0
        dery=0.0
        derintx=1.0
        derinty=0.0
        reason=False
        for i in range(1, maxiter):
            if zx2+zy2 > R:
                reason=True
                break
            if abs(derintx)+abs(derinty) < eps:
                n0+=1
                break
            derx0 = (zx*derx - zy*dery)
            derx0 = derx0 + derx0 +1.0
            dery = (zx*dery+zy*derx)
            dery = dery + dery
            derx = derx0
            derintx0 = (zx*derintx - zy*derinty)
            derintx0 = derintx0 + derintx0
            derinty = (zx*derinty+zy*derintx)
            derinty = derinty + derinty
            derintx = derintx0
            zy = zx*zy
            zy = zy+zy + y0
            zx = zx2-zy2 + x0
            zy2 = zy*zy
            zx2 = zx*zx

        if reason== False:
            pixels[x, y]=mandel_color #Mandelbrot set
        else:
            r2 = zx2+zy2
            rd2 = derx**2+dery**2
            d2 = r2*math.log(r2)/rd2
            t = d2/seuil
            if t>1.0:
                t=1.0
                n2+=1
            if t<0.0:
                t=0.0
            pixels[x, y]=rgb_conv(i,t)

# to display the created fractal after
# completing the given number of iterations
print(' End computing at ' + str(datetime.datetime.now())+' - n1='+str(n1)+' - n2='+str(n2))
img.show()
img.save("mandelbrot.png", "PNG")
#img.save("mandelbrot.bmp", "BMP")
Back to my HOME PAGE
E-mail: eric.chopin@wanadoo.fr